
Prototype Nav Article Device
Sonny Xi {{ crumb }}
Los Angeles, CA — publishing since 2025

I write the research most desks keep internal.

I'm Sonny — a self-driven researcher who covers a wide range of ground and learns in public. MS Finance out of Illinois Gies, international affairs and finance at GW before that.

I publish long-form notes where macro meets capital structure: the rate cycle, the AI build-out financing it, energy and the geopolitics that moves it, and what all of it does to an allocation — full framework, full exhibits, and the limitations left in rather than cut.

Most of it starts as a question I could not answer from someone else's note, so I build the model and find out. I write in Chinese first and publish English editions for readers abroad.

{{ s.value }} {{ s.label }}

Right now

Tracking the hiking cycle month by month — the September note is up, and the Q4 update is in the data now.

Coverage

Macro and rates, energy and commodities, geopolitics, technology and semis, asset allocation, financials. Notes go up here first and then to LinkedIn.

Available now

Looking for research, macro strategy and buy-side analyst seats. U.S. permanent resident — no sponsorship, ever. Say hello.


Newest — September 20, 2026

The market has priced easing out entirely.

Across the January, June and December 2027 meetings, FedWatch puts the odds of a cut at 0.0%, 0.0% and 0.1%. Eleven pages on how that turn happened since the February war, and on what is in the long end that the oil price alone does not explain.

{{ s.value }} {{ s.label }}
In Charts — first page

Latest research

Everything

Where I currently stand

The framework
{{ v.kicker }}

{{ v.claim }}

{{ v.body }}

{{ v.src }}

How I work

Four kinds of work, four processes. What holds across all of them: every thesis ships with the condition that would retire it, and the limitations stay in the document rather than getting cut for length.

{{ m.kicker }}

{{ m.title }}

{{ s.num }} {{ s.body }}

Six desks in three years

Full CV
{{ j.years }} {{ j.role }} {{ j.org }}
Available now

Looking for a research seat where the work gets published.

Research, macro strategy and buy-side analyst roles. U.S. permanent resident — no sponsorship required now or in the future.

Eight notes — 2025 to now

Research

Long-form notes, published whole — framework, exhibits, sources and limitations. Start with the September rate-cycle piece; it is the shortest way into how I think. Nothing here is investment advice; the risk section at the end of each one says why.

← All research
Oil & Gas — Market Distortion Theory

The Weakening of OPEC's Pricing Power

A new landscape of shadow markets and competition for oil supply. Geopolitical fragmentation is fundamentally altering global oil pricing mechanisms — and it has cost OPEC the information advantage its monopoly rested on.

October 2025 26 min read — 23 pages EnergyCommodities Download the full PDF →
Core investment logic

A shadow trading system running parallel to the traditional market has stripped OPEC of the information advantage its monopoly rested on, turning it from price setter into market-share defender.

{{ s.label }} {{ s.value }} {{ s.note }}

Foreword and core investment logic

This note explores current investment opportunities in the oil market. The core logic rests on what I call Market Distortion Theory: geopolitical fragmentation is fundamentally altering global oil pricing mechanisms, and the distortion is now large enough to break the feedback loop OPEC depends on.

A dual-track market has formed. The Russia–Ukraine conflict and Middle East tensions have spawned a shadow trading system parallel to traditional markets. Russia and Iran are delivering substantial crude volumes to Asia at discounted prices through shadow fleets and non-dollar settlement. This dual-track system suppresses apparent prices — but more importantly, it undermines market information transparency.

OPEC's pricing power is structurally weaker. Its monopoly historically rested on two pillars: production capacity control and information advantage. With significant volumes now transacting in opaque parallel markets, OPEC has lost the ability to accurately gauge true supply and demand. Unable to track competitors' actual production and sales, its market adjustment mechanisms are failing — and the asymmetry is forcing it from price setter to market-share defender.

Demand resilience is systematically underestimated

Markets are overly focused on EV penetration rates while overlooking three facts. First, oil demand in developing countries continues to accelerate. Second, even in China — where EVs are expanding rapidly — oil demand is still hitting new highs. Third, subsidy rollbacks under global fiscal pressure could significantly slow electrification.1

Fossil fuels still account for over 60% of global energy supply, a structure unlikely to change in the near term. Faster growth in electricity demand than in clean-energy deployment causes absolute fossil consumption to rise rather than fall — which helps explain why the transition is running slower than policy expectations. Continued cost declines could still accelerate it; the trend needs watching, not assuming.

OPEC total crude oil production, thousand barrels/day. Source: OPEC 2024 ASB, OPEC August 2025 MOMR.

Drain the pond to catch fish

Current high production is essentially depleting existing capacity.

On the surface, all three major supply sources — OPEC, North America, and Russia–Iran — are increasing production to compete for share. Deeper in the data there is an overlooked contradiction: rig counts are continuously declining, well completions are hitting new lows, and capital expenditure has been slashed. US rigs fell from 688 in 2023 to 538 in August 2025, with Mexico and Canada on similar paths. OPEC's own rig count has moved sideways in a 412–444 band despite announced increases.

Completed wells peaked in 2019 and have declined since across the major OPEC members. Even if investment resumed immediately, oil-field development cycles mean new capacity takes years to contribute, while natural decline continues eroding total capacity in the meantime. This production model foreshadows a potential supply gap in the next three to five years.

Investment implications

In the short term, oversupply from three-way competition will suppress oil prices. But that is precisely what creates positioning opportunities for forward-looking investors: when markets recognise the supply gap, new projects will require three to ten years from initiation to production, potentially creating upside beyond current expectations.

From a medium-to-long-term allocation perspective, the characteristics that matter in an oil company are a healthy financial condition able to weather downcycles, rapid production-expansion capability, a track record of returning value through stable dividends, and a complete industrial chain with lower sensitivity to price volatility.2

Investors seeking higher returns could look at oil services and exploration companies during supply-side recovery, as these carry high sensitivity to price volatility. Timing is difficult and the risks are higher, so this note makes no specific recommendations for such high-beta targets.

Key risk considerations

The current global economy faces geopolitical conflict, fiscal pressure, slowing growth and inflation all at once, with high uncertainty; severe downside would push actual trends away from this analysis. Oil is among the most volatile commodities in the world, with complex pricing mechanisms. The data here comes from public institutions — OPEC, IEA, FRED — which carry perspective biases, lag, and in places gaps left by the conflict itself.

This note represents my own views and analytical framework. It is for academic exchange and idea reference only and does not constitute investment advice. Investors should combine their own research and judgment, and bear their own risk.

Footnotes

1Global demand is forecast at 106.5 mb/d for 2026 — a new high, above 2019. Sources: OPEC August and September 2025 MOMR, OPEC 2024 ASB, IEA.

2Section 09 of the full note applies these four criteria as a screen and works through three cases. See the framework page.

Stated limitations — section 10 of the note
{{ r.num }} {{ r.title }} {{ r.body }}
How the allocation work fits together

Framework

Five things sit behind everything on this site: the transmission chain I read the cycle through, the three checks I run on a rate path, the three layers I decompose a conflict into, what a five percent return objective actually costs, and the screen I use to own the energy cycle without owning the timing risk.


The spine — from the H2 2026 outlook

The transmission chain, and what changed in it

Everything starts from leading indicators — PMI, permits, new orders, the curve — rather than the payrolls print the market watches. They matter because they transmit in a known order, and that order is set by interest-rate sensitivity: Housing → Orders → Profits → Employment. The further up the chain, the stronger the lead; employment is the last domino.

{{ h.letter }} {{ h.label }}
{{ h.now }}

{{ h.body }}

The 2026 amendment is the first link. Housing never recovered, yet PMIs are in expansion — because data-center capital expenditure has taken over as the engine that starts the chain. That substitution is what most of my current work is about, and it is why a rate decision now lands on the AI build-out instead of on mortgages.


Rates — how I read the path

Three checks before I have an opinion on rates

The market prices the path with real money every day. My job is not to guess against it but to find where it disagrees with the Fed, and to know which part of a yield move I am actually looking at.

{{ c.num }}

{{ c.title }}

{{ c.body }}

{{ c.eg }}

Geopolitics — from the US–Iran note

Interest, motivation, behavior — and reading it backwards

A war is never an isolated act, and following the daily cycle of strikes, sanctions and oil prints means being led by the news. Any conflict decomposes into three layers, and they transmit in one direction: interests → motivations → behaviors. Analysis runs the other way — you observe the behavior that already happened, infer the motivation, recover the interest, then use it to anticipate the next move. Sun Tzu calls the exercise miào suàn.

{{ l.num }} {{ l.layer }}

{{ l.body }}

{{ l.eg }}

The payoff is a test for deadlock. When the balance of force is even, the interests leave neither side room to retreat, and both sides can read each other's motivations clearly, you have a stalemate rather than a contest — and the break, when it comes, arrives from outside the two combatants.


Asset allocation — July 2026

The difficulty of a five percent target depends entirely on how you define it

A 5% nominal target is readily achievable today with high-quality fixed income, at roughly one-fifth the volatility of a conventional balanced portfolio. A 5% real target, net of fees, sits at or beyond the edge of what the full investable universe can reasonably support.

{{ s.label }} {{ s.value }} {{ s.note }}
{{ t.label }} {{ t.verdict }}

{{ t.body }}

Constrained efficient frontiers under three client liquidity regimes; ten-year annualized basis, data as of July 16, 2026. Not investment advice — see the note's limitations section.


Energy screen — October 2025

Four criteria, then the numbers

If the supply gap is the thesis, the question becomes which balance sheets survive the downcycle that comes first. The screen is deliberately boring.

{{ c.num }} {{ c.body }}
MetricExxonMobil (XOM)Chevron (CVX)Shell (SHEL)Integrated industry
{{ m.metric }} {{ m.xom }} {{ m.cvx }} {{ m.shel }} {{ m.ind }}

As of October 18, 2025, based on Q2 2025 company reports. Debt/equity shown as reported by each source: company figures in percent, industry benchmark as a ratio. Sources: Yahoo Finance, NYU Stern, Full Ratio. Case analysis illustrating the screen — not a recommendation.


The stack behind it

{{ w.kind }} {{ w.year }}

{{ w.title }}

{{ w.blurb }}

{{ s }}
About / CV

Two degrees, six desks, one habit.

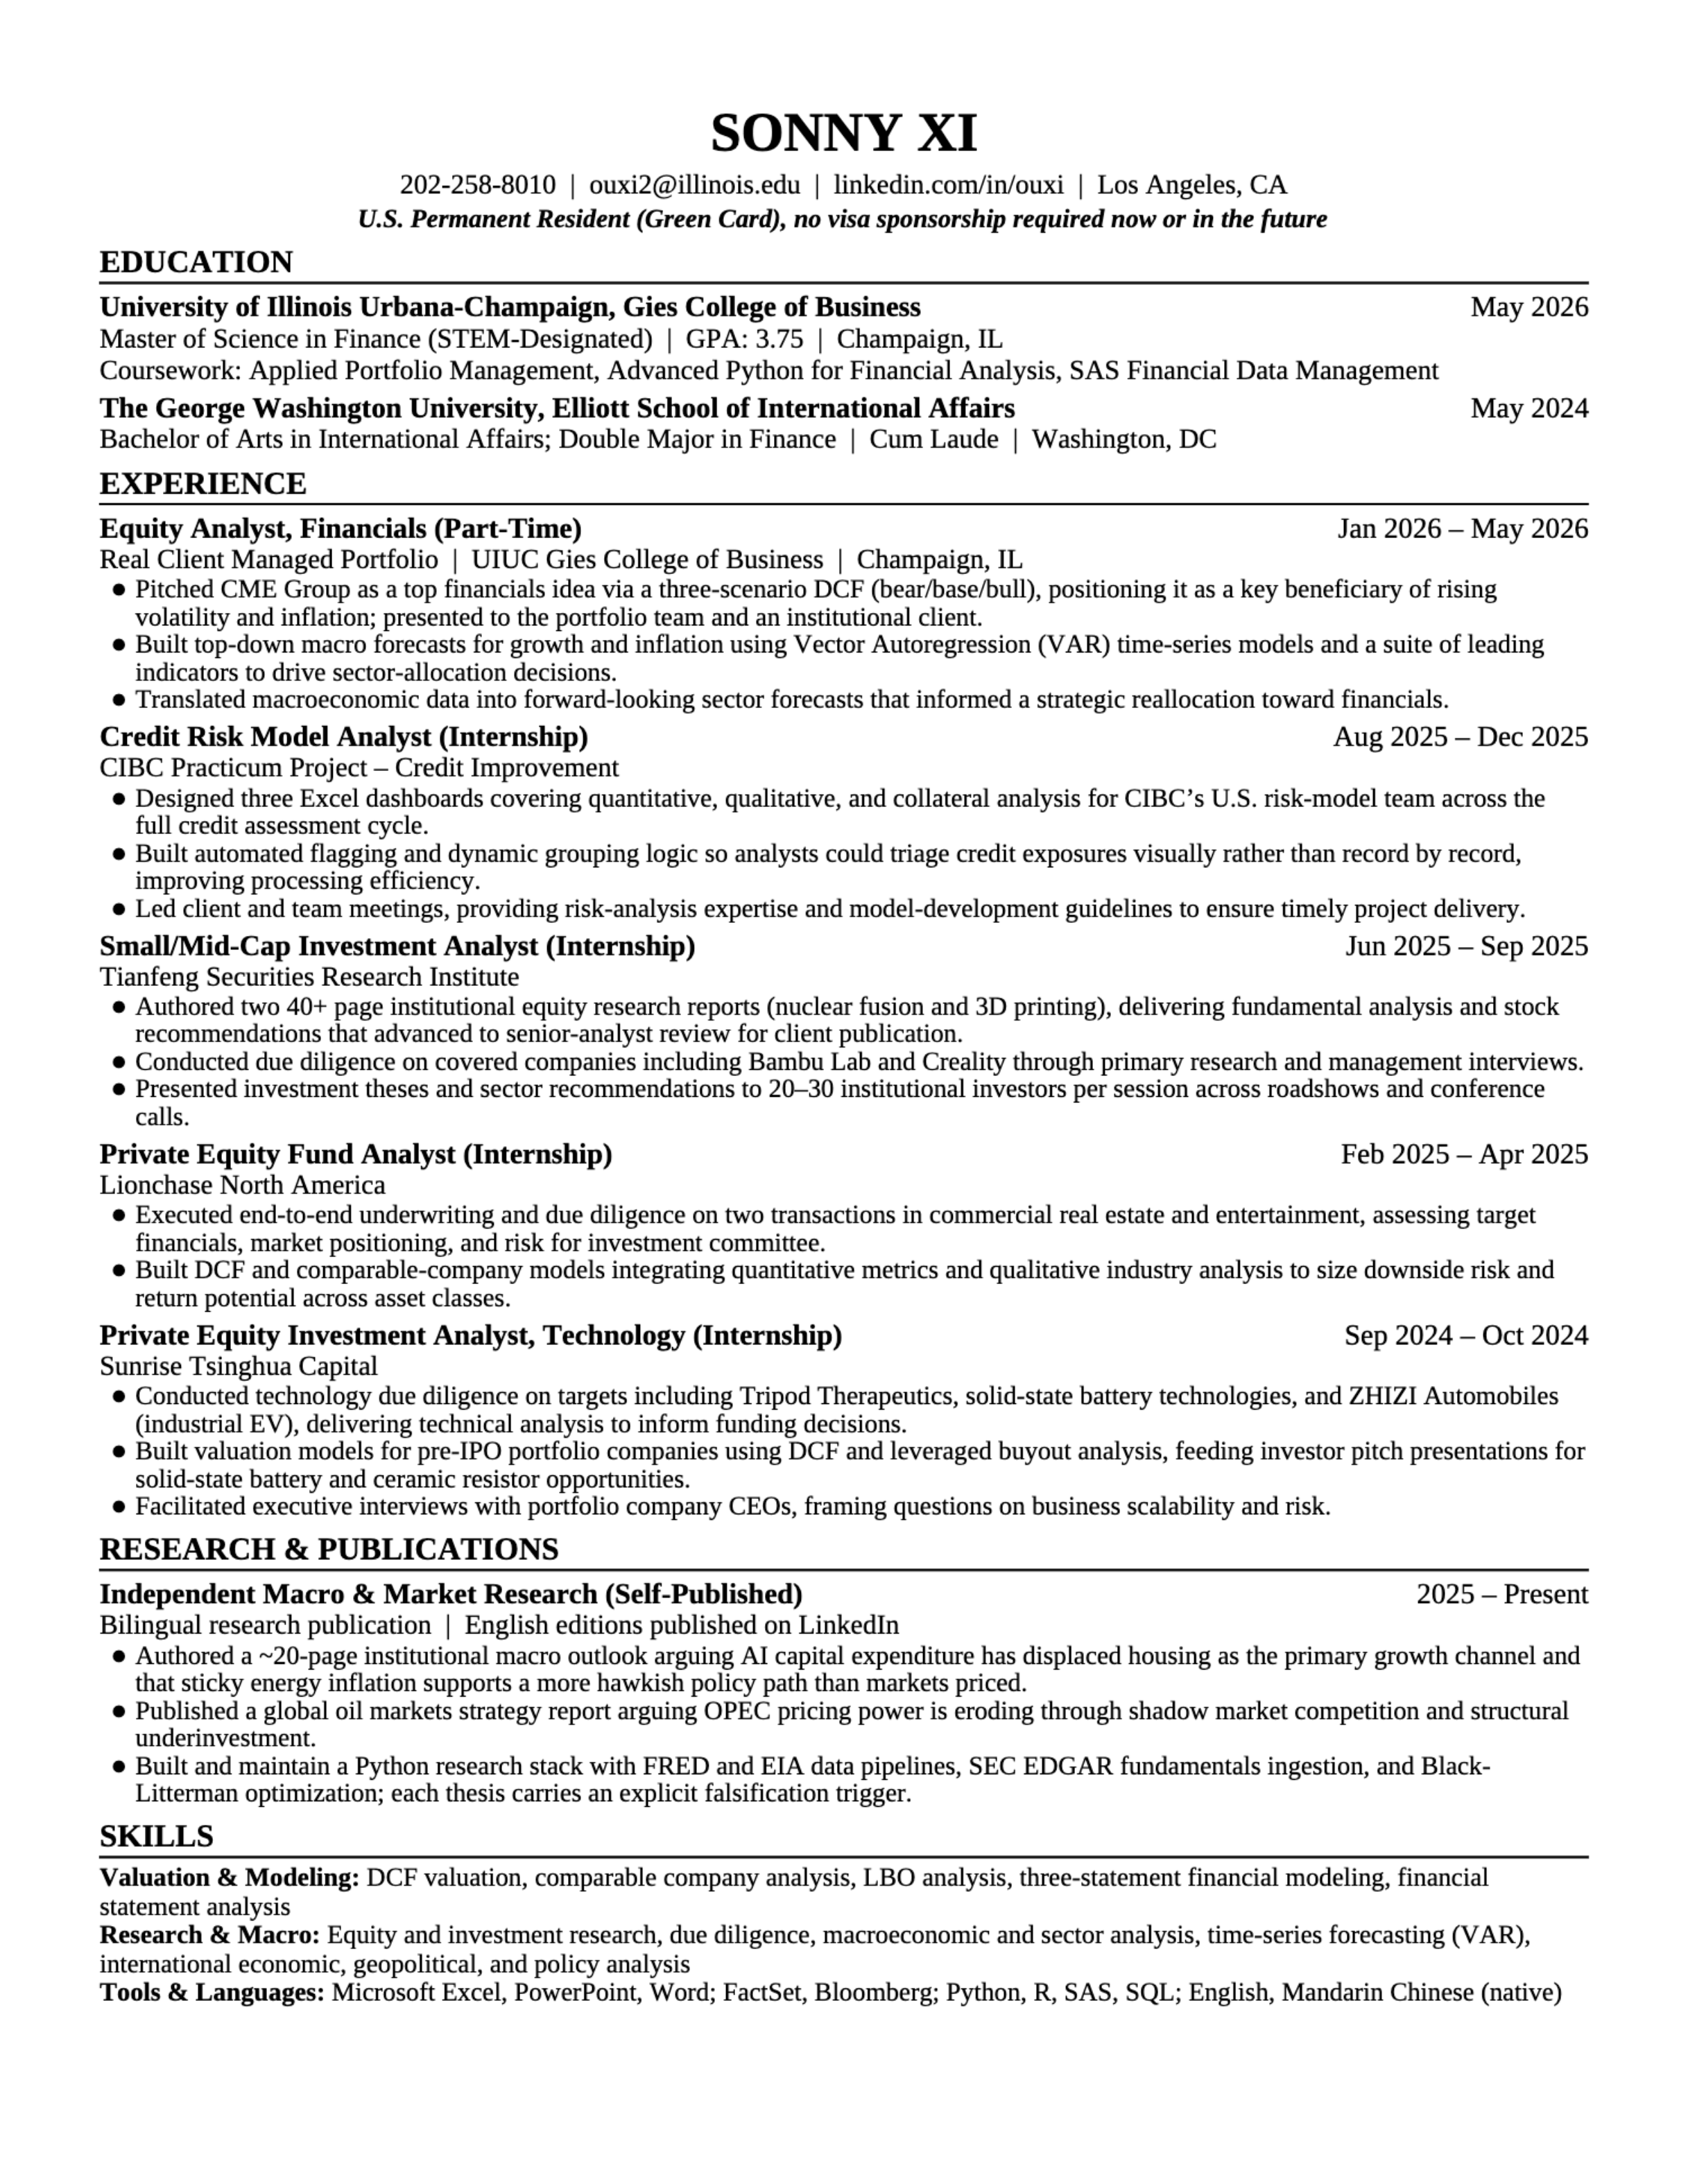
I'm Sonny Xi, an investment researcher based in Los Angeles. I hold an M.S. in Finance from the University of Illinois Urbana-Champaign and a B.A. in International Affairs and Finance from the George Washington University's Elliott School, and my work has run across sell-side equity research, buy-side portfolio analysis, private equity due diligence, and credit risk modeling.

That range shaped how I think. I care less about calling a direction than about building frameworks that state plainly what they rest on and what would prove them wrong.

Most of what I publish here sits where macro meets capital structure: how AI capital expenditure has taken over the growth role housing used to play, why energy inflation has proven stickier than headline figures suggest, and how the financing architecture behind the AI buildout rhymes with earlier credit cycles. The Elliott School half of my training shows up too — when a war moves an energy curve, I would rather map the interests behind it than follow the headlines. I write in Chinese first and publish English editions for readers abroad, and I try to keep both plain enough that the argument, rather than the vocabulary, does the work.

Los Angeles, CA · 202-258-8010 · U.S. permanent resident, no sponsorship required now or in the future.

Experience

WhenRoleWhere
{{ j.years }} {{ j.role }} {{ j.org }}

Education

ConferredDegreeInstitution
{{ e.when }} {{ e.degree }} {{ e.school }}

Skills

{{ s.group }}
{{ i }}

Résumé

PDF · one page · updated 2026 Open full screen Download PDF
← All research
{{ note.kicker }}

{{ note.title }}

{{ note.sub }}

{{ note.dateLabel }} {{ note.lengthLabel }} {{ t }}
Summary

{{ para }}

What it concludes
{{ f.num }} {{ f.body }}

The full note

{{ note.fileLabel }} Open full screen Download PDF Read the full note
Page {{ pdfPage }} / {{ pdfTotal }} Zoom

{{ note.exhibitNote }}

Read the full note →
{{ note.noPdfTitle }}

{{ note.noPdfBody }}

Email me about this note
© 2026 Sonny Xi — Los Angeles, CA. Independent research, not investment advice. Email LinkedIn Résumé
Sonny Xi

Macro, rates and geopolitical research. Los Angeles, CA.